

Your site's health on one screen
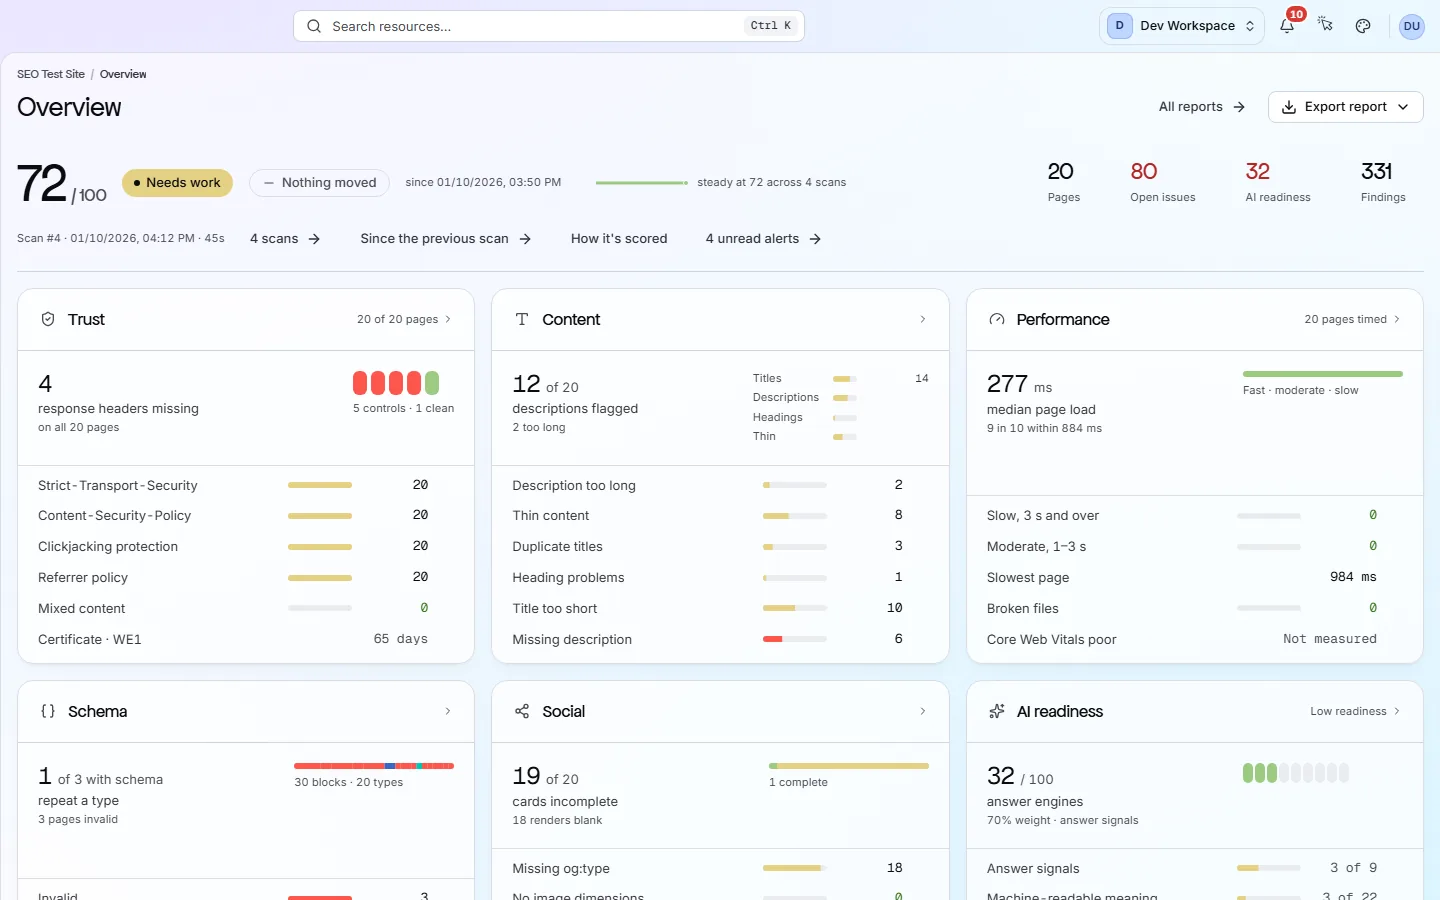
The Overview is the first screen you see for a site. It shows your health score, what changed since the last scan and where the problems are. Click any number to see the detail behind it.
What it tells you
Questions this screen answers
What people want to know when they open this screen, and where to find the answer.
- 01
Is my site better or worse than last time?
The figure beside your score shows how many points it moved since the last scan. The chips count checks that broke (started failing) and cleared (started passing). A small line shows your score over recent scans.
- 02
How big is the problem?
Look at the four counts under the score. Open issues is how many checks are failing. Findings is how many pages they fail on in total. A few issues with thousands of findings usually means one shared template is at fault.
- 03
Where should I look first?
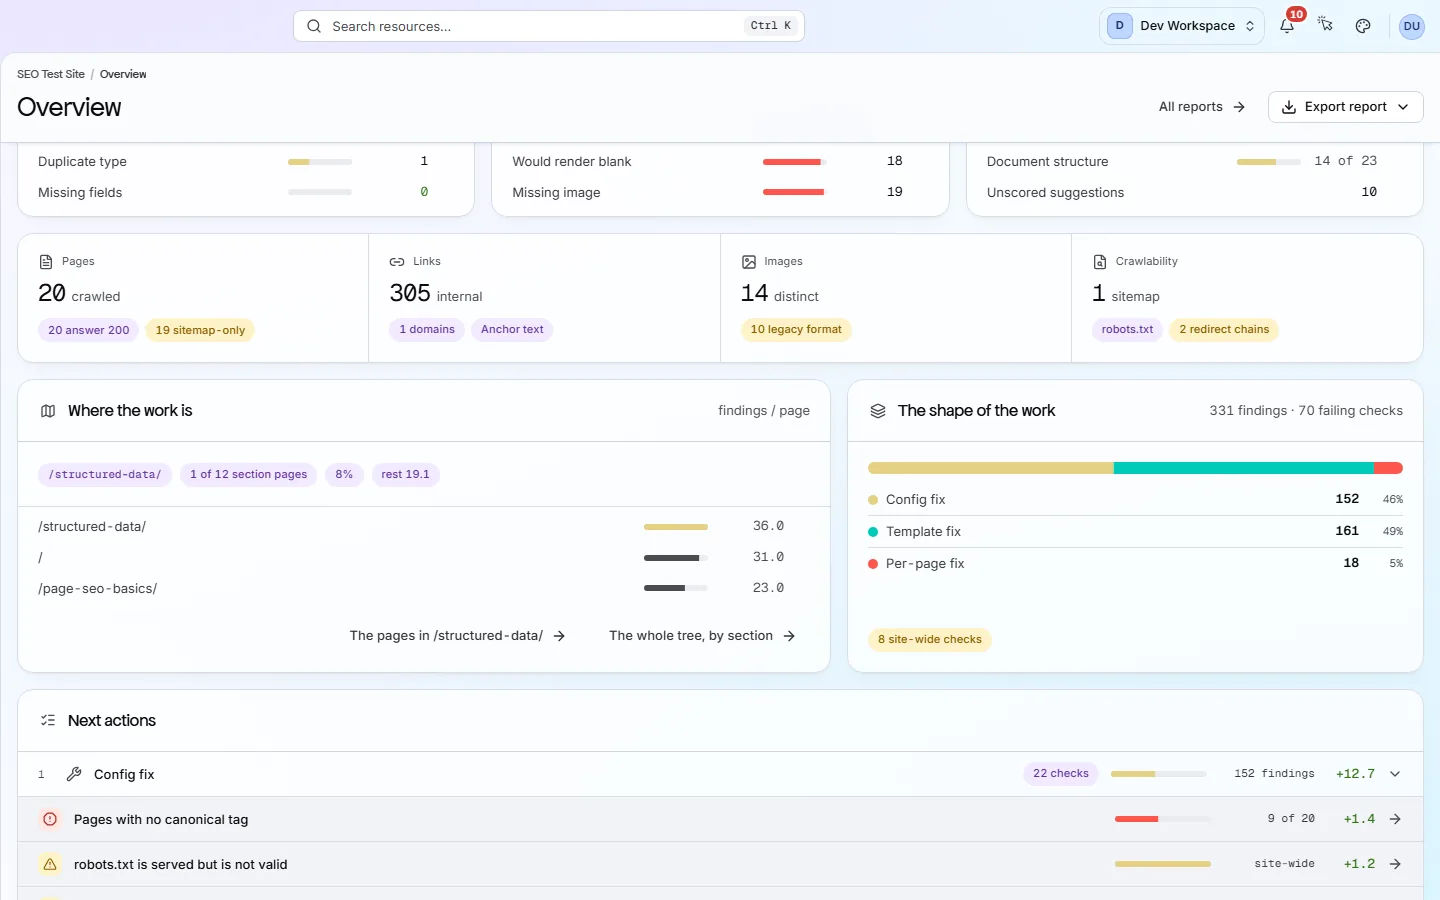
Start with the panel that has the most flagged rows, and click a row to see the pages behind it. The “Where the work is” card shows which part of your site, such as /blog/, has the most problems per page.
- 04
How much could my score go up?
The to-do list shows your score today beside the score you would reach if every failing check passed. Each item shows the points you win back by fixing it. These match the numbers on the Issues screen.
- 05
Is my search traffic going up or down?
From Basic, once you connect Google Search Console, the Search traffic card shows your Google Web search clicks, impressions, CTR (the share of impressions that got a click) and average position for the last 28 days. Each figure shows its change from the 28 days before. Google's latest two to three days are provisional.
Good to know
The main facts about this screen, and the check categories it shows.
Check categories shown here
On-Page
These checks look at each page's title, meta description, headings and URL. They flag any that are missing, empty, duplicated on other pages, too long or too short, including pages with more than one H1, because these are the first things search engines read and show.
Structured Data
Structured data is code on a page that tells search engines exactly what the page is, such as a product, an article or an FAQ. These checks validate it for 31 schema.org types, because markup with errors cannot earn rich results.
Delivery & Trust
These checks cover HTTPS, SSL certificates (including ones about to expire), outdated TLS versions, security headers, mixed content, compression, render-blocking scripts and page size. On Hobby and above, once you add your own Google API key, they also flag poor Core Web Vitals (Google's measures of loading speed and visual stability) and Lighthouse findings such as unused code, oversized images and short cache times.
Crawlability
Your robots.txt file and your sitemaps tell search engines which pages to visit. These checks read both, and they flag sitemaps that list broken, blocked or duplicate pages, CSS and JavaScript files that robots.txt blocks, and pages that failed to load during the scan.
Key facts
Before you open this screen
- Your health score is out of 100: Excellent from 90, Good from 75, Needs work from 50, Critical below.
- Chips beside the score show how many checks broke and how many cleared since the last scan.
- Six panels sum up Trust, Content, Schema, Social, Performance and AI readiness.
- A to-do list groups problems by the kind of fix they need, and shows your score if all were fixed.
What's on the screen
The screen, part by part
Each part of the screen, from top to bottom.
- 01
The score
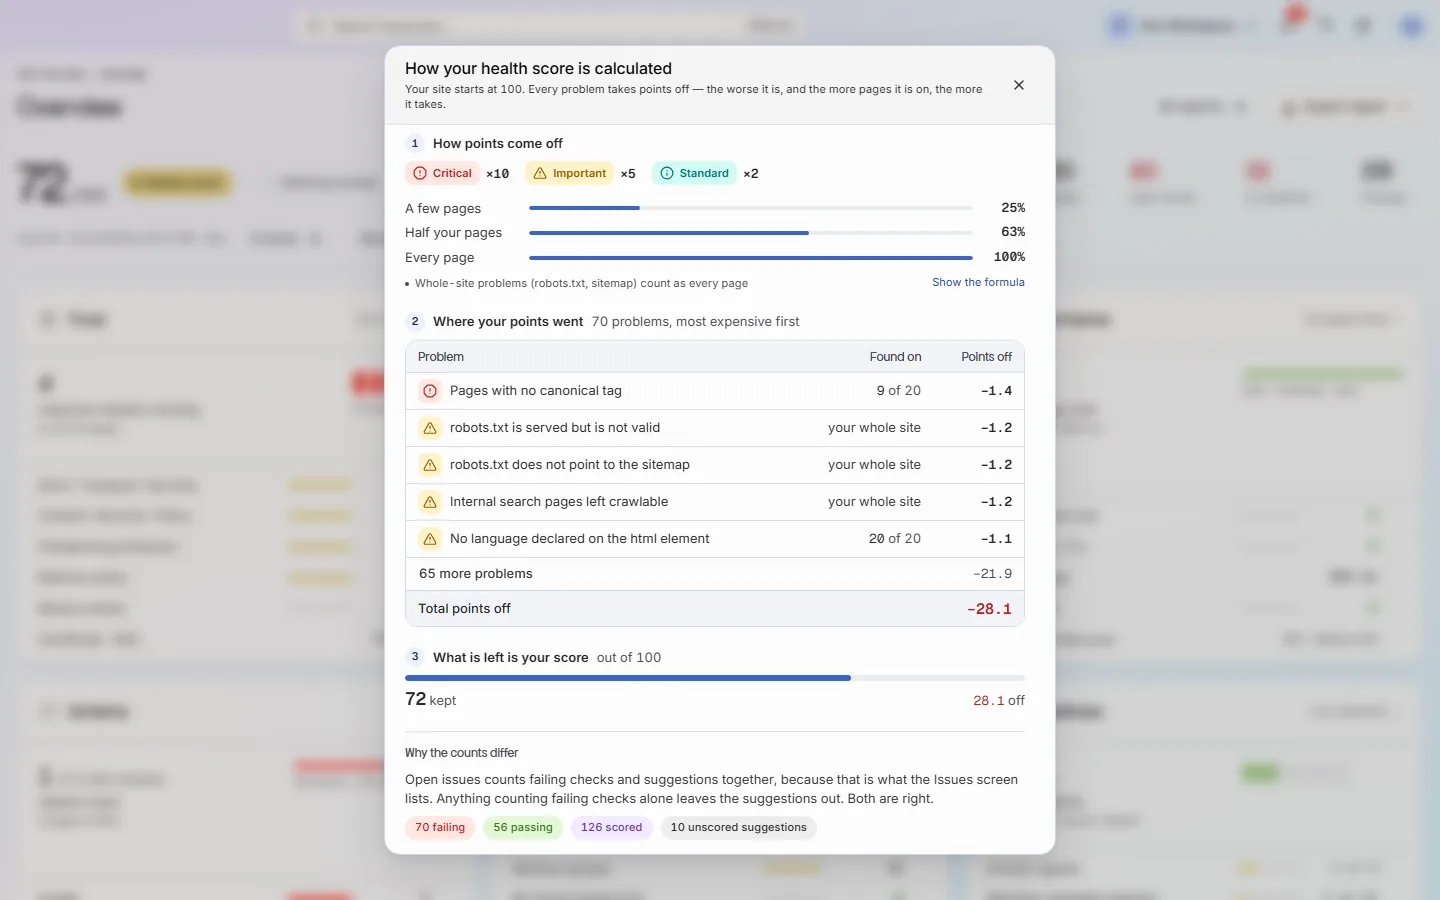
Your health score out of 100, its label, and how far it moved since the last scan. “How it's scored” lists the checks that took points off. Four counts sit beside it: Pages, Open issues, AI readiness and Findings.
- 02
Six panels
Trust, Content, Schema, Social, Performance and AI readiness each show a headline figure and a few flagged rows. Click a row to open the pages behind it. The Core Web Vitals row needs Hobby or above and your own Google API key.
- 03
Search traffic
From Basic, with Google Search Console connected. Four figures from Google Web search over the last 28 days, each against the 28 days before: clicks, impressions, CTR and average position, with clicks per day below. Under it, “Your recent fixes” lists your best measured fixes, and two weekly charts set your health score above your Google clicks, with your scans marked.
- 04
What the scan found
Counts for Pages, Links, Images and Crawlability, with small badges for things worth a look. Examples are pages with errors, images without alt text and pages missing from your sitemap. Click a badge to open that list.
- 05
Where the work is
This card ranks the parts of your site, such as /blog/ or /docs/, by problems per page. A small section with lots of problems stands out. Beside it, “The shape of the work” splits problems by the kind of fix they need.
- 06
The to-do list
Called Next actions, it sorts failing checks into three groups. A Config fix is one server or settings change. A Template fix is one change to a shared layout. A Per-page fix has to be made on each page.
Your first visit, step by step
A simple order to follow after your first scan.
- 1
Read the chips beside the score to see what broke and what cleared.
- 2
Click Open issues to see every failing check, biggest first, on the Issues screen.
- 3
Open the panel with the most flagged rows and click a row to see the pages.
- 4
Start with the Config fix group: each one is a single change that fixes the whole site.
More views
Other tabs on this screen
The other tabs and views on this screen.
FAQ
Common questions about this screen
Which scan am I looking at?
Your latest finished scan. If you open an older scan from Scan history, a “Historical scan” bar appears at the top. Press Back to live to return to the latest one. Search traffic and the cards under it are not shown on a past scan's overview: they describe your site's traffic now, not that scan.
Will I be told when my score drops?
Yes, on every tier. In the site's Settings, the Alerts tab can email the site's members when the score drops or a new critical problem appears. The same alerts can go to Slack or to a webhook (a web address that receives the alert).
What does the first scan show?
Everything except the comparison. The chip beside the score reads “First scan on this branch”. From the second scan on, you also see what broke and what cleared.
Does it show whether my fixes helped my search traffic?
It shows how the pages you fixed did compared with the rest of your site, not whether the fix caused it. With Search Console connected, “Your recent fixes” lists up to three fixes whose pages did better than the rest of the site after the change, such as “these pages did 15% better than the rest of the site”. Each is measured over the 28 days before the fix and 28 days after, starting 7 days later. The card appears once a fix has a final result, and All results opens every measured change on Search performance.
Can I download this as a report?
Yes. Export report downloads it as PDF, CSV, XLSX, JSON or Markdown, on every tier. On Free the report lists the problems without the fix steps.
Continue the product tour
Next screen
Screens follow the order of the app’s menu. See the full list to jump to any of them.
See what is wrong with your site
Add your site and get your score, your to-do list and a fix guide for every problem. Free for one site and 500 pages a month. No card, no time limit.
No card needed · Nothing to install · Cancel any time