

Every page the scan found
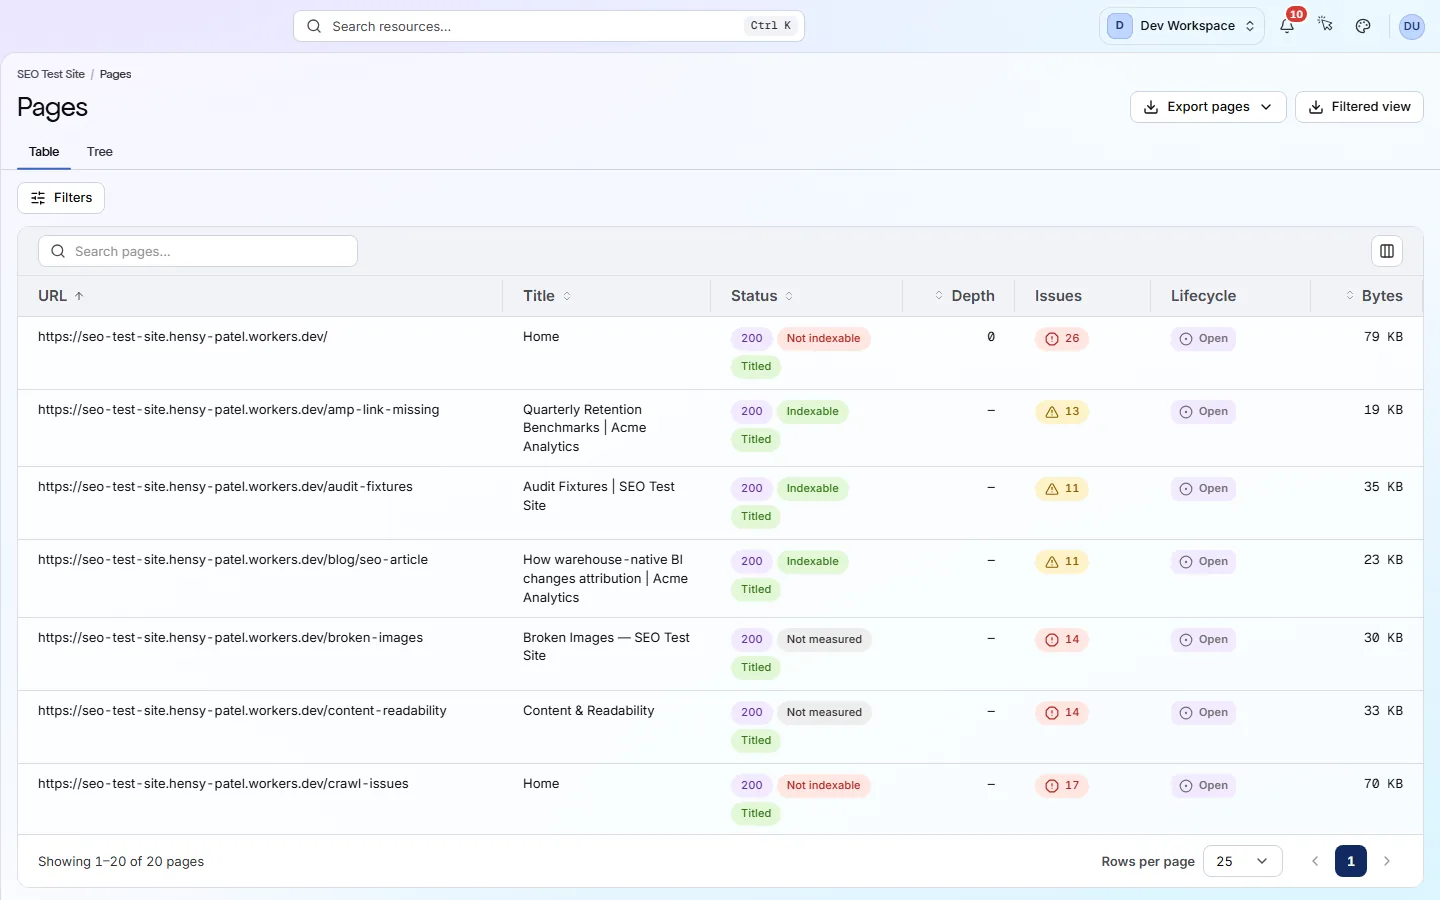
The Pages screen lists every URL the scan found, as a table or a folder tree. Filter it to find broken or hidden pages. Open any page for a full report on it.
What it tells you
Questions this screen answers
What people want to know when they open this screen, and where to find the answer.
- 01
Which pages did the scan find?
All of them, including ones it could not read. Filters and sorting cover the whole scan, not just the rows on screen. Set Crawl result to Not crawled to see URLs that were found but not read.
- 02
Which pages are broken?
Pick a status code in the strip above the table, such as 404 (page not found) or 500 (server error). Fix or redirect those pages. The Links screen shows which pages still link to them.
- 03
Which pages are missing from my sitemap?
Open Filters and choose Sitemap. Not in sitemap lists pages the scan reached by links but your sitemap leaves out. Orphaned lists pages in your sitemap that no page links to.
- 04
What does one page's report show?
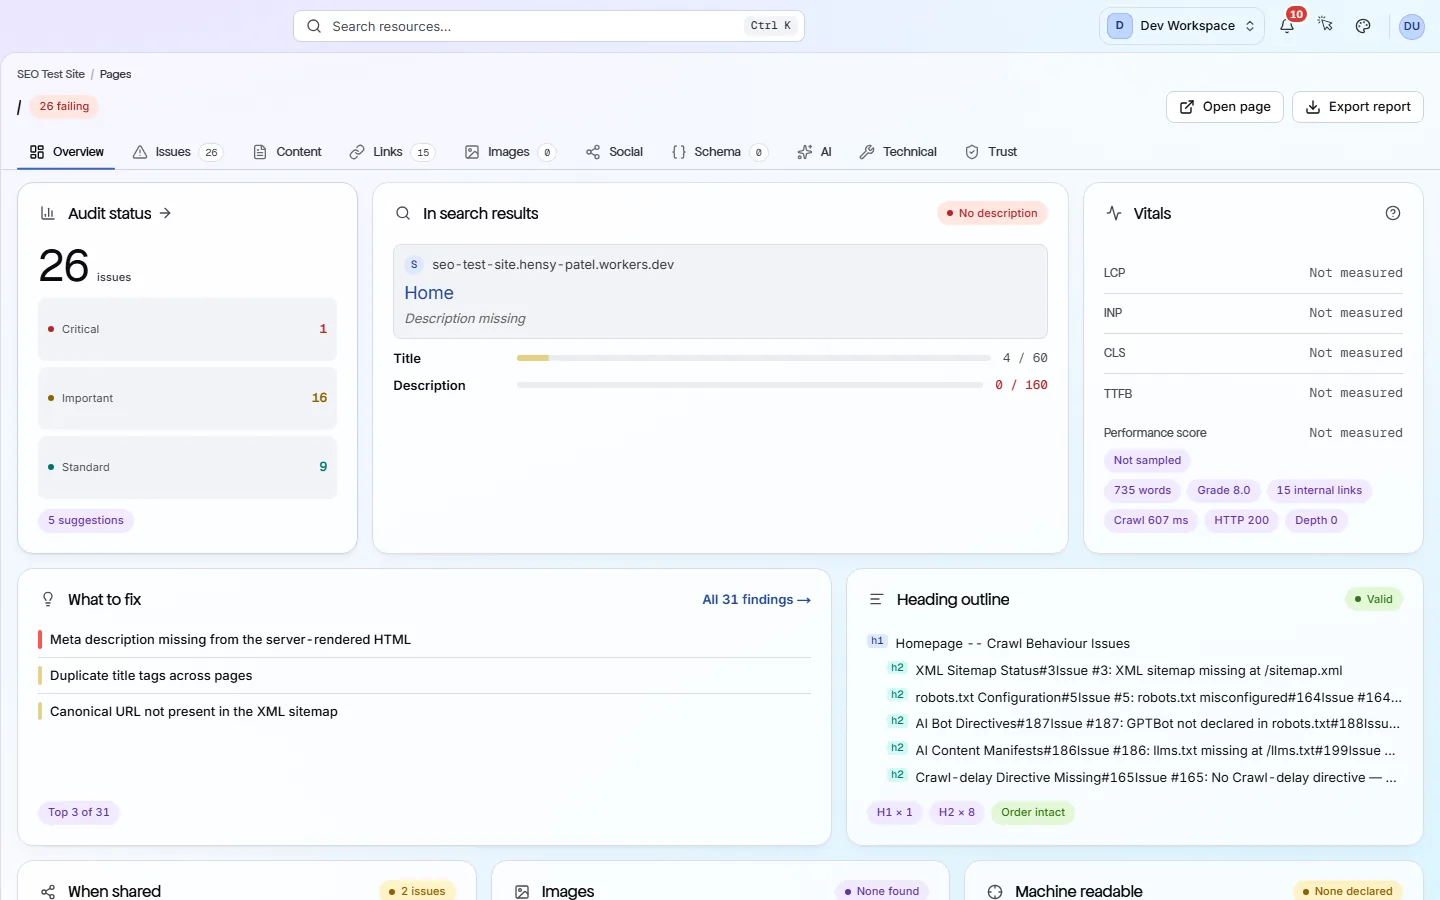
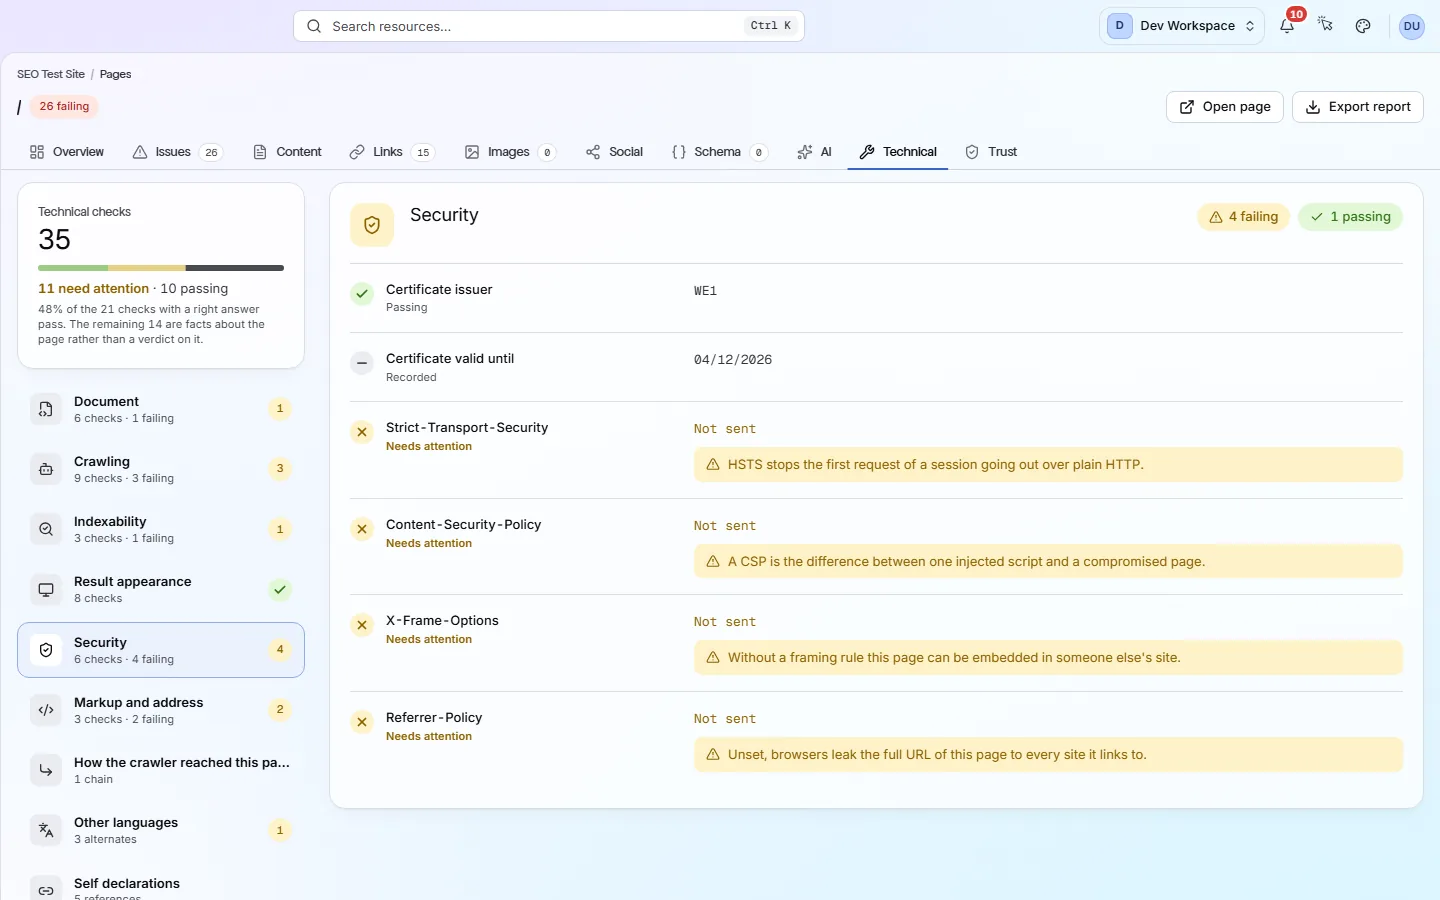
Ten tabs: Overview, Issues, Content, Links, Images, Social, Schema, AI, Technical and Trust. Together they show everything the scan recorded about that page. Use it when a problem is on one page only.
- 05
Which pages get the most search traffic?
From Basic, once you connect Google Search Console, the table adds Clicks and Impressions columns: each page's Google Web search figures for the last 28 days. Click either column to sort by traffic, busiest first. A note above the table says how many pages Search Console data matched, such as “matched 812 of 940 pages”.
Good to know
The main facts about this screen, and the check categories it shows.
Check categories shown here
On-Page
These checks look at each page's title, meta description, headings and URL. They flag any that are missing, empty, duplicated on other pages, too long or too short, including pages with more than one H1, because these are the first things search engines read and show.
Content & Answers
These checks find thin pages, near-duplicate pages, leftover placeholder text and content that is hard to read. They also check whether you publish an llms.txt file and whether it follows the format.
Indexability
A page can be reachable and still be kept out of search results. These checks look at canonical tags, noindex and nofollow rules, pagination and soft 404s (error pages that report success) to show which pages search engines may index. They also catch canonicals that point at broken, redirected or noindexed pages, or that contradict each other.
Key facts
Before you open this screen
- Each row shows the page's status code, its click depth (clicks from your homepage) and its issue count.
- Filter by status code, severity, sitemap, depth, indexability, word count, size, response time and more.
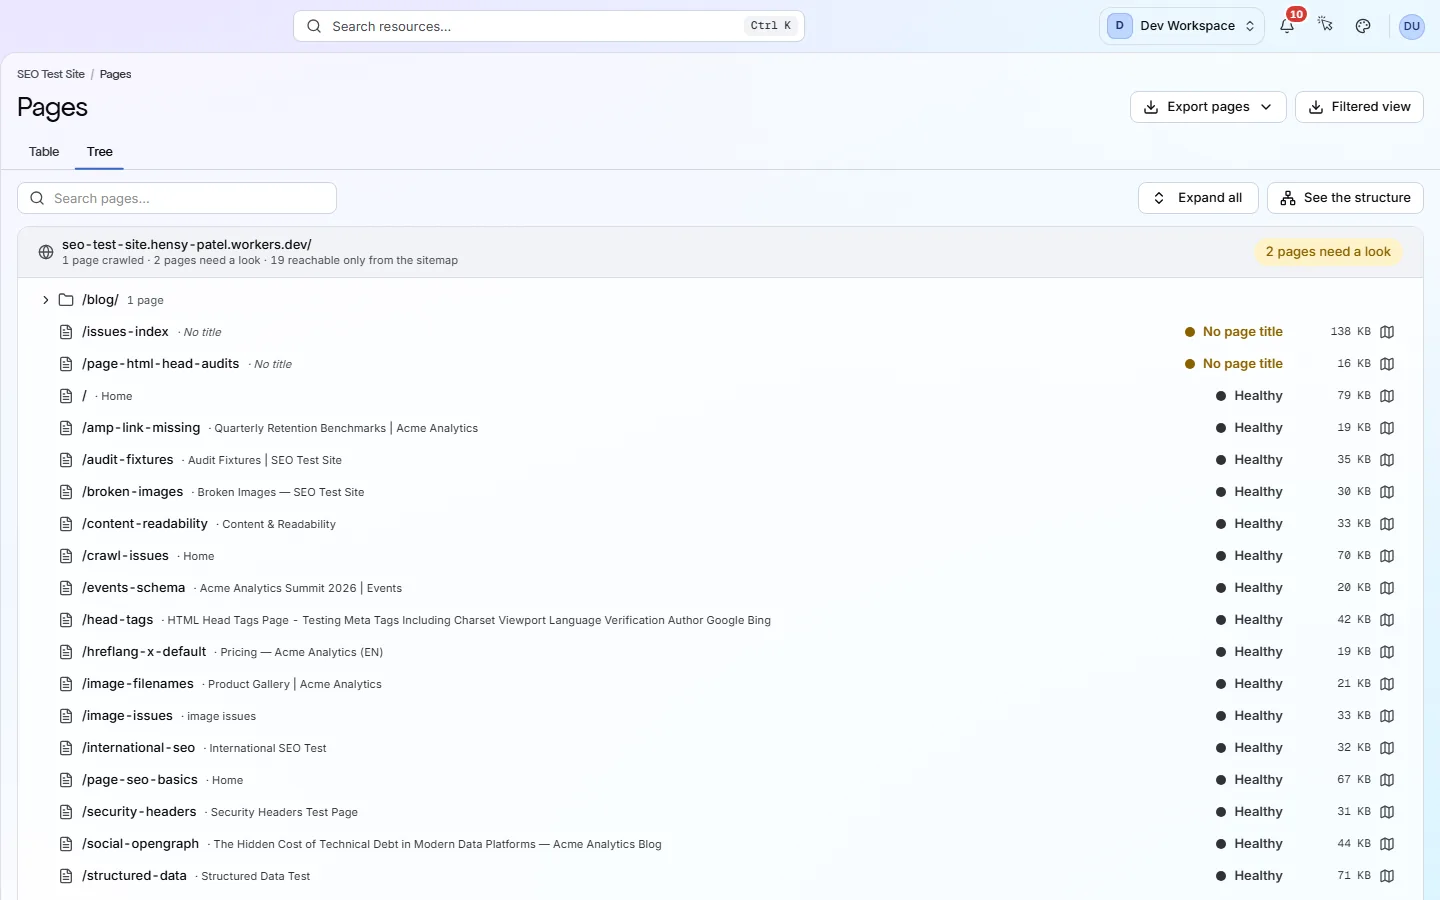
- The Tree view groups pages into folders, so you see which part of the site needs work.
- Any page opens a report with ten tabs, from its issues to its security headers.
What's on the screen
The screen, part by part
Each part of the screen, from top to bottom.
- 01
Table or Tree
The Table is best for filtering and sorting. The Tree shows your site as folders, with a count of pages that need a look.
- 02
Search and filters
Search by URL or pick a status code. Filters narrow by crawl result, severity, sitemap, depth, indexability, structured data, word count, size, response time and inlinks (links pointing to a page).
- 03
The table
Columns show URL, Title, Status, Depth, Issues, Lifecycle and Bytes. Lifecycle compares each page with the last scan: New, Regressed, Resolved, Open or Unchanged. With Search Console connected, Clicks and Impr. (impressions) join them and Bytes starts hidden; the column menu brings it back.
- 04
Page report
Click any row to open that page's report. Its ten tabs cover issues, content, links, images, social cards, structured data, AI signals, technical tags and security.
Your first visit, step by step
A simple order to follow after your first scan.
- 1
Pick a 4xx code in the status strip to list pages that return errors.
- 2
Set Indexability to Not indexable, and check none of those should be in search results.
- 3
Switch to Tree to see which folders need the most work.
- 4
Open one of those pages and read its Issues tab.
More views
Other tabs on this screen
The other tabs and views on this screen.
FAQ
Common questions about this screen
Why is a page missing from the list?
Your robots.txt may block it, or an exclude pattern may skip it. Nothing may link to it and it may not be in your sitemap. Or the scan hit your page limit: 500 on Free, 5,000 on Hobby, 10,000 on Basic, 15,000 on Pro.
Does it run JavaScript on my pages?
It can, from Pro up. By default PixyScan reads the HTML your server sends, which is fast. Turn on JavaScript rendering in Settings, Crawl tab, if your pages build their content in the browser. Scans then take about 7.6 times as long.
Does it measure page speed?
Yes, from Hobby up, with your own Google API key. PixyScan tests a sample of pages with Google PageSpeed Insights and records Core Web Vitals (Google's speed and stability scores). Pages outside the sample are marked not sampled.
Can I export the list?
Yes, from Hobby up. Export downloads the pages report for your filters. Filtered view downloads the table exactly as you see it, as a CSV file.
Why does a page show a dash for clicks?
Search Console had no Google Web search data for that address in the last 28 days. Pages are matched to Google's addresses with http, https, www, a trailing slash and tracking parameters ignored. Redirects are not followed, so a page Google knows only by another address shows a dash.
Continue the product tour
Previous and next screens
Screens follow the order of the app’s menu. See the full list to jump to any of them.
See what is wrong with your site
Add your site and get your score, your to-do list and a fix guide for every problem. Free for one site and 500 pages a month. No card, no time limit.
No card needed · Nothing to install · Cancel any time