

User guide3 min
Performance
The Performance screen shows how heavy and how fast your pages are. The Resources tab works on every tier. The two speed tabs start at Hobby and need your own Google PageSpeed API key.
How to get there#
Performance is in the Explore group of the site sidebar, between Images and AI readiness.
- 1
Open Performance in the sidebar
Open the site, then choose Performance under Explore. It always opens on the Resources tab.
- 2
Start on Resources, then move to the speed tabs
Resources comes from the scan itself, so it always has data. Core Web Vitals and Chrome UX Report only fill in when the scan ran with a PageSpeed API key, on Hobby or above.
app.pixyscan.com/w/…/s/…/performance
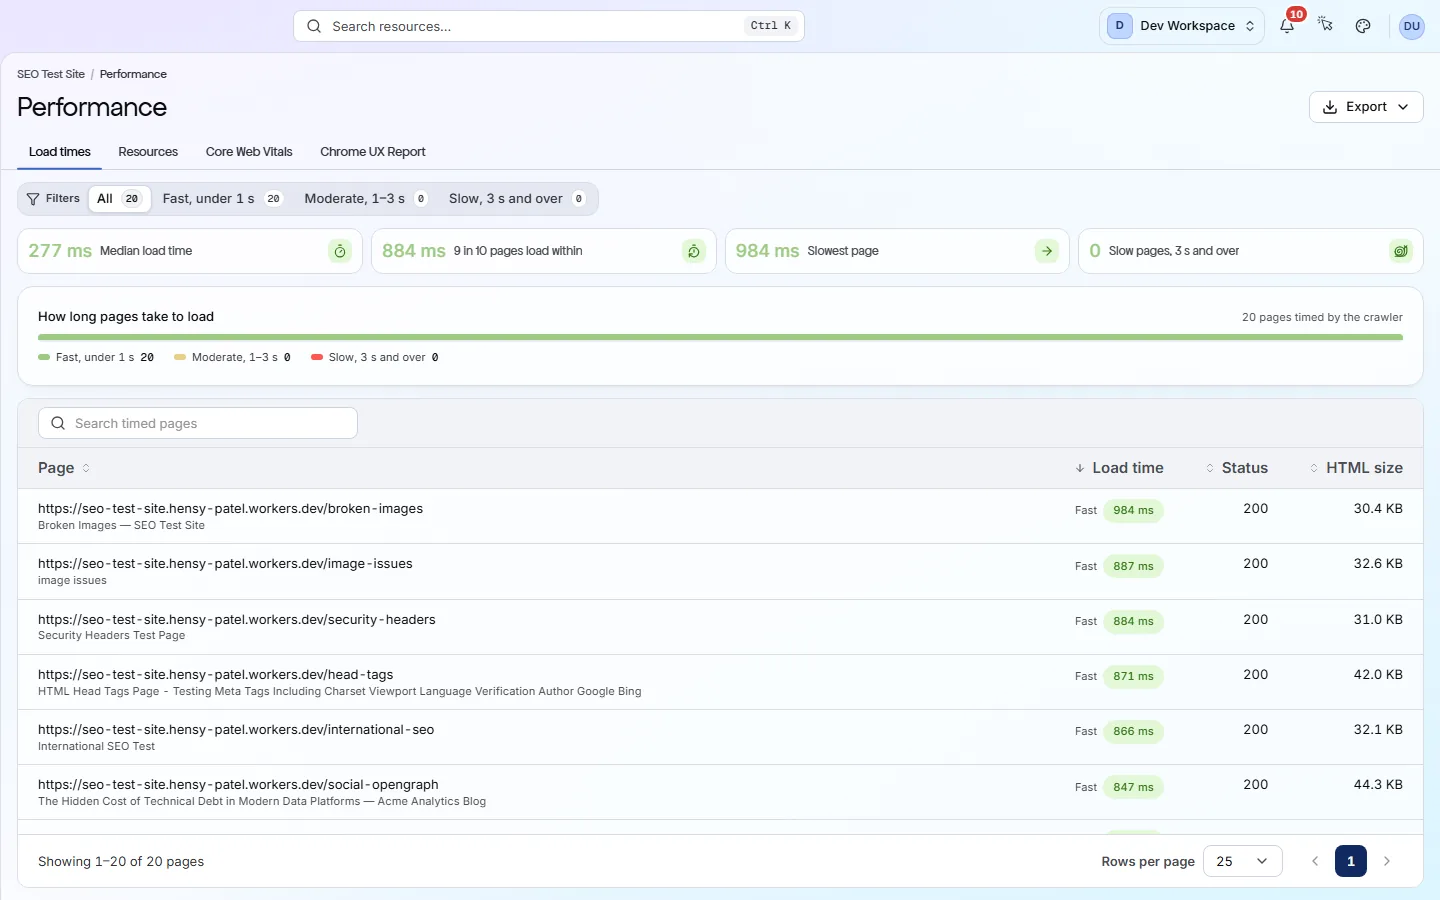
The three tabs#
One tab comes from the scan. The other two come from Google's speed services.
| Field | Source | What it does |
|---|---|---|
| Resources | The scan | Every file each page loads, with its type, size in bytes and HTTP status. The tiles count Files recorded, Broken files, Not probed (files the scan never requested) and Answered under 400 (files that loaded normally). |
| Core Web Vitals | PageSpeed Insights | Core Web Vitals are Google's page speed measures. A Lighthouse test (Google's lab speed test) runs on a sample of your pages and shows LCP, INP, CLS, TTFB and a Score from 0 to 100 for each. The tiles show pages measured, the median score, and sampled pages that could not be measured. |
| Chrome UX Report | CrUX | Real-visitor data Google collects from Chrome users over the last 28 days, for the whole site (the origin) and each sampled page. Google only publishes it once there is enough traffic, so new and quiet sites often show No data. |
What the four metrics mean#
Each value is green for good, amber for needs improvement and red for poor, using Google's limits.
| Field | Good · Poor | What it does |
|---|---|---|
| LCP | ≤ 2,500 ms · > 4,000 ms | Largest Contentful Paint: how long the biggest image or block of text takes to appear. It is the best single measure of how fast a page feels. |
| INP | ≤ 200 ms · > 500 ms | Interaction to Next Paint: how quickly the page responds after a click, tap or key press. It needs real visitors, so a Lighthouse-only reading shows Not measured. |
| CLS | ≤ 0.1 · > 0.25 | Cumulative Layout Shift: how much the content jumps around while the page loads. It has no unit. Lower is better. |
| TTFB | ≤ 800 ms · > 1,800 ms | Time to First Byte: how long your server takes to start answering. It is not a Core Web Vital, but a slow server delays everything after it. |
A value between the two limits counts as needs improvement. Use the Poor LCP, Poor INP, Poor CLS and Poor TTFB filters to list only the red pages for that metric.
The Device column shows the device the test used (mobile). If the test failed for a page, it shows the error Google returned instead.
Set up the PageSpeed API key#
Google refuses requests without a key, so nothing is measured until you save your own.
- 1
Create a key in the Google Cloud console
Create an API key in a Google Cloud project and turn on the PageSpeed Insights API for that project. The same key also fetches Chrome UX Report data.
- 2
Save it for the whole workspace
Paste it into the PageSpeed reports card on Workspace settings and press Save PageSpeed settings. Every site in the workspace then uses it.
- 3
Or give one site its own key
In that site's Settings, open the Crawl tab and find the PageSpeed reports card. Turn off Use workspace PageSpeed settings and fill in Site PageSpeed API key.
- 4
Run a new scan
The key is used from the next scan on. Older scans without a key say “Nothing was measured: this scan ran with no PageSpeed API key”.
Why are the speed tabs empty? PageSpeed reports start at Hobby
Read the results#
Start with the pages Google marks as poor. Then use Resources to find what makes them heavy.
PixyScan does not test every page with PageSpeed Insights. Each scan measures a fixed sample: your homepage and your most-linked pages. The line under the key field shows how many URLs per scan that is.
Why is my page missing? Pages outside the sample do not appear on Core Web Vitals at all. A missing page is not a failed one.
On Resources, each row is one file on one page, so a shared file appears once per page. Check the Bytes column to find the heaviest files. Use the CSS, JS and FONT filters to see what kind they are, and pick Broken to list files that answered with an error.
Slow pages also show up on Issues
Does something here not match what you see in the app? Tell us