

User guide5 min
The site overview
The overview is the first screen you see when you open a site. It shows your health score out of 100, what changed since the last scan, and a card for each area of the site. Use it to see if the site got better or worse, and where to look next.
The health score#
A number out of 100. A site with no failing checks scores exactly 100.
PixyScan runs 202 checks on your pages. A check is one test, such as “every page has a title”. A finding is one place where a check failed.
Passing checks cost nothing. So if your score is below 100, every missing point comes from a failed check. There is no hidden deduction, and this screen shows every reason.
app.pixyscan.com/w/…/s/…
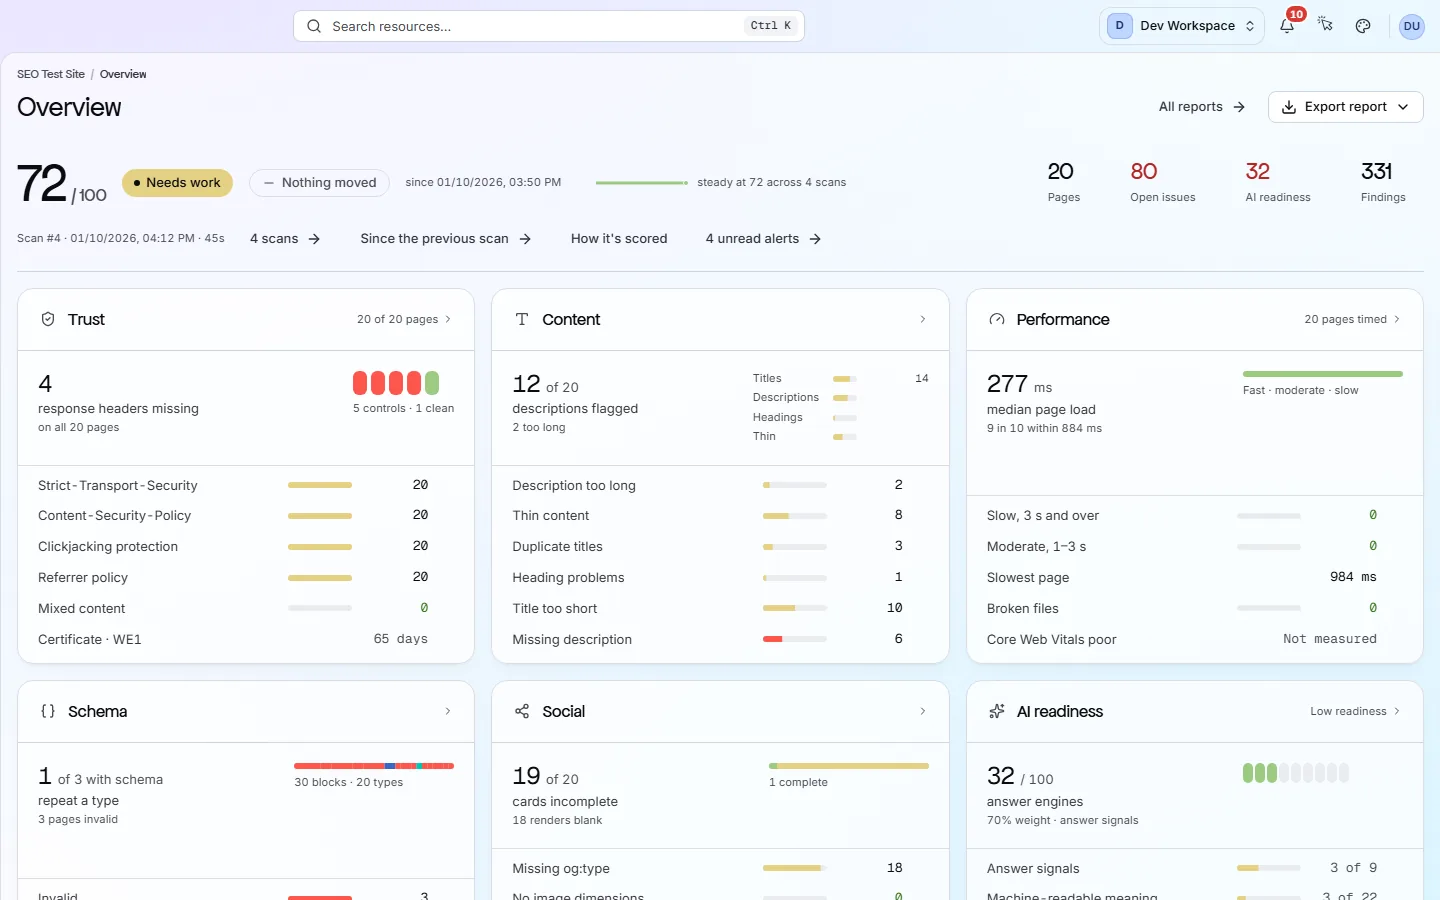
| Field | Example | What it does |
|---|---|---|
| Score | 83 / 100 | The health score from the scan you are looking at. |
| Band | Good | A word for the score's range: Excellent (90 or more), Good (75 to 89), Needs work (50 to 74) or Critical (below 50). |
| Change | −1 | Points gained or lost since the previous scan of the same branch. On a site's first scan it says “First scan on this branch” instead. |
| Broke and cleared | 4 broke · 2 cleared | Broke: checks that passed last time and fail now. Cleared: checks that failed last time and pass now. If nothing changed, it says Nothing moved. |
| Trend | 83–84 across 4 scans | A small chart of recent scores, with the lowest and highest beside it. On a first scan it shows the points lost at each severity instead. |
| Counts | Pages · Open issues · AI readiness · Findings | Pages crawled, checks failing, the AI readiness score and the total findings. Each one links to its own screen. |
How a failed check lowers the score#
Severity sets the base cost. The number of pages affected scales it up.
Severity means how much harm one instance of a problem does. 126 checks are scored, each with one of three severities. The other 24 are suggestions: advice that costs nothing.
| Field | Weight | What it does |
|---|---|---|
| Critical | 10 | Can stop a page from being found, indexed (added to a search engine) or trusted. |
| Important | 5 | Weakens a page in search or AI answers, but the page still works. |
| Standard | 2 | A small problem. Fix it next time you edit the page. |
| Suggestion | 0 | Advice only. Suggestions show in the list but never cost points. You can ignore them all and still score 100. |
A problem on every page costs far more than the same problem on one page. Each category also has its own multiplier, so a crawling or indexing failure costs more than one that only changes how a shared link looks.
A mistake in a shared template usually hits every page that uses it. That is why template fixes are often the quickest way to raise the score.
How it's scored
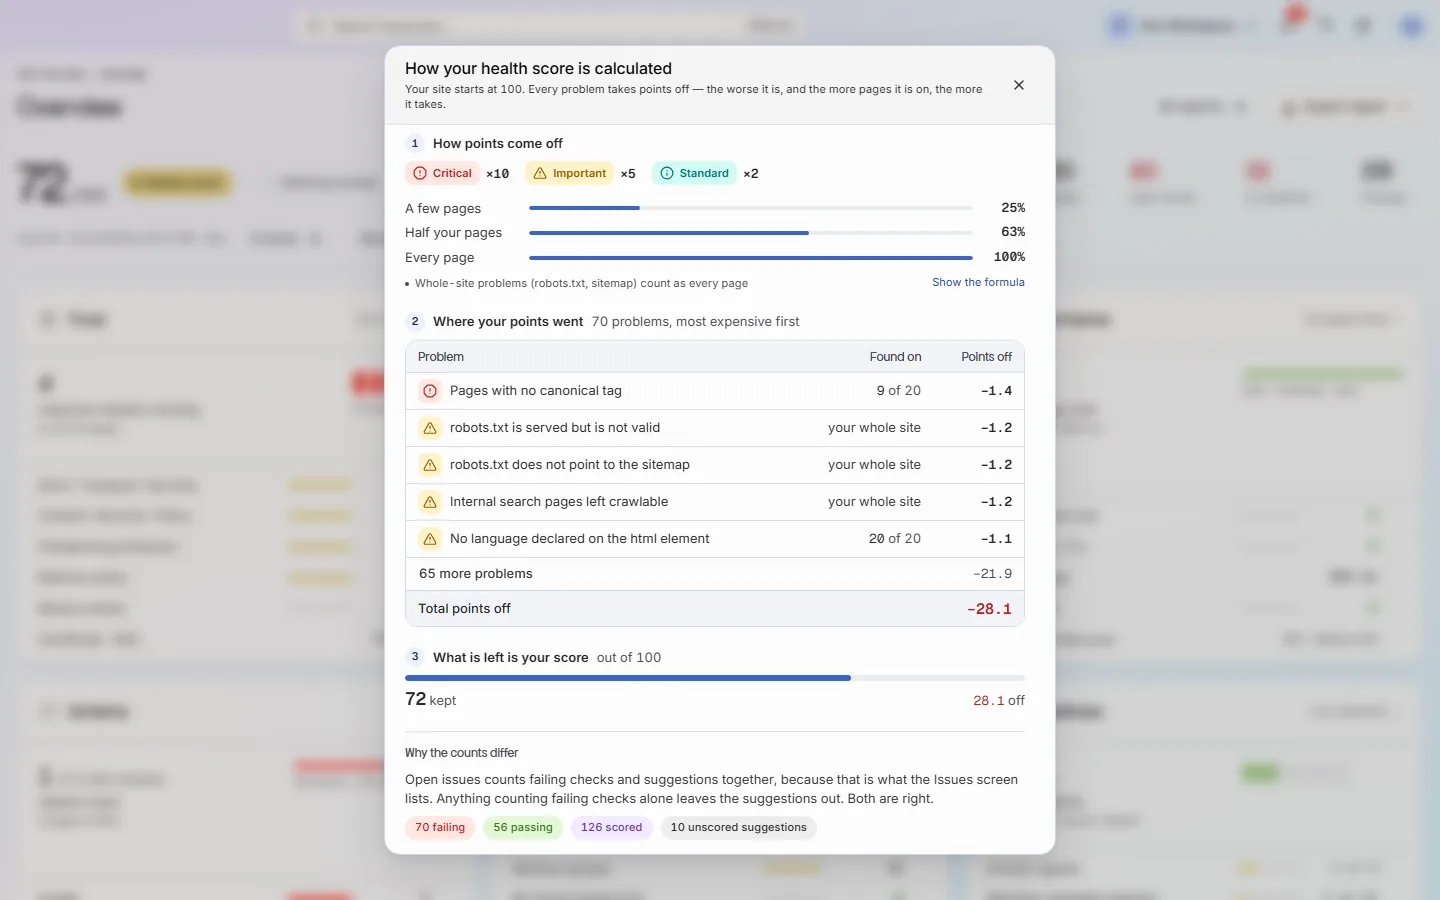
Want the exact formula?
The links below the score#
Each link opens a screen that explains the score in more detail.
| Field | Goes to | What it does |
|---|---|---|
| N scans | Scan history | Every scan this site has run. |
| Since the previous scan | Changes | This scan compared with the one before. Shows only once the site has two or more scans. |
| How it's scored | A dialog | Every failing check behind the score and the points each one costs. |
| N unread alerts | Site alerts | This site's alerts. Shows only when there are unread alerts. Viewers do not see it. |
Why do I see “Unlocks after scan 2”? Trend line, Changes and Score Δ compare two scans. On a site's first scan there is nothing to compare with yet.
A card for each area#
Six cards: Trust, Content, Performance, Schema, Social and AI readiness. Click one to open its screen.
Each card shows a headline figure and the worst problems behind it. For example, Trust shows missing security headers and when your certificate expires. A card with nothing to report says so instead of showing a zero.
Why is the Performance card empty? Core Web Vitals (Google's page speed scores) need the Hobby tier or above, and a Google API key added in the workspace settings.
Connected to Search Console? A Search traffic card sits below the six cards, with the site's Google clicks, impressions, click-through rate and average position over the last 28 days. Under it, Your recent fixes and weekly charts of your health score and clicks appear once there is data for them. See Measure the impact of your fixes.
Lower on the same screen
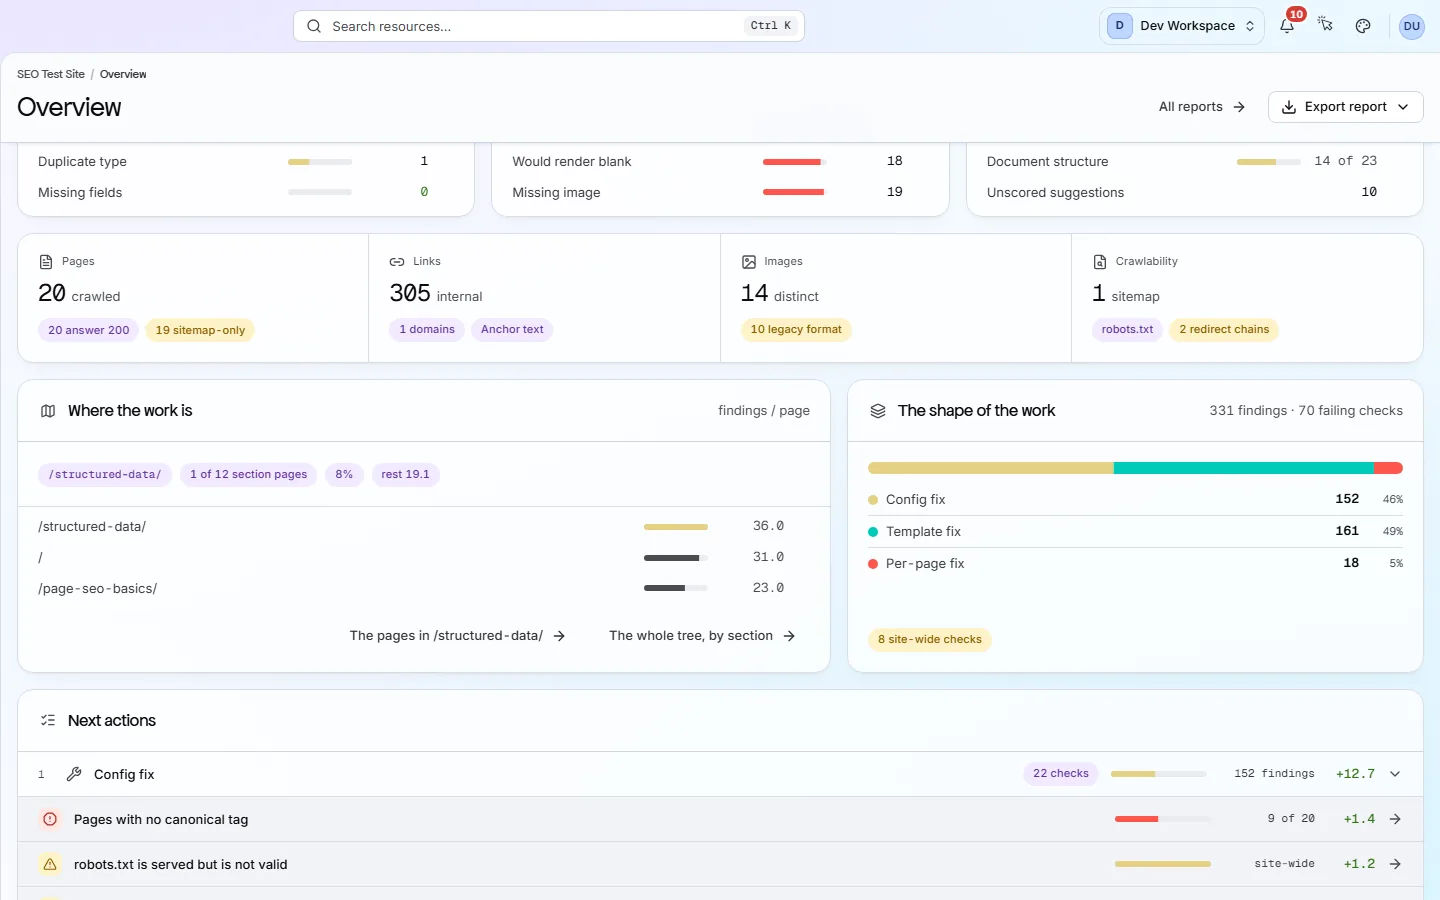
| Field | Section | What it does |
|---|---|---|
| Where the work is | By folder | The three sections of your site, such as /blog, with the most findings per page. |
| The shape of the work | A bar | How your findings split between the three kinds of fix below. |
| Next actions | Three groups | Failing checks grouped by kind of fix. Config: one server or settings change fixes every page. Template: one change to a shared layout. Per-page: done page by page, such as titles or alt text. |
Compare a site with itself, not with other sites
Does something here not match what you see in the app? Tell us