

User guide3 min
Reports
The Reports screen is where you download a scan as a file. It could be a PDF for a client, a spreadsheet of every broken link, or raw data for your own tools. Pick a report, then pick a format.
How to get there#
Reports is the first item in the Monitor group of the site sidebar.
- 1
Choose Reports in the site sidebar
It is the first item in the Monitor group. You can also type a report's name into the search box at the top of the screen.
- 2
Check which scan the report covers
A report always covers the scan you are viewing, which is normally the latest one. For an older scan, open it from Scan history first, then come back to Reports.
- 3
Open Export on a row and pick a format
The file downloads in the format you chose.
app.pixyscan.com/w/…/s/…/reports
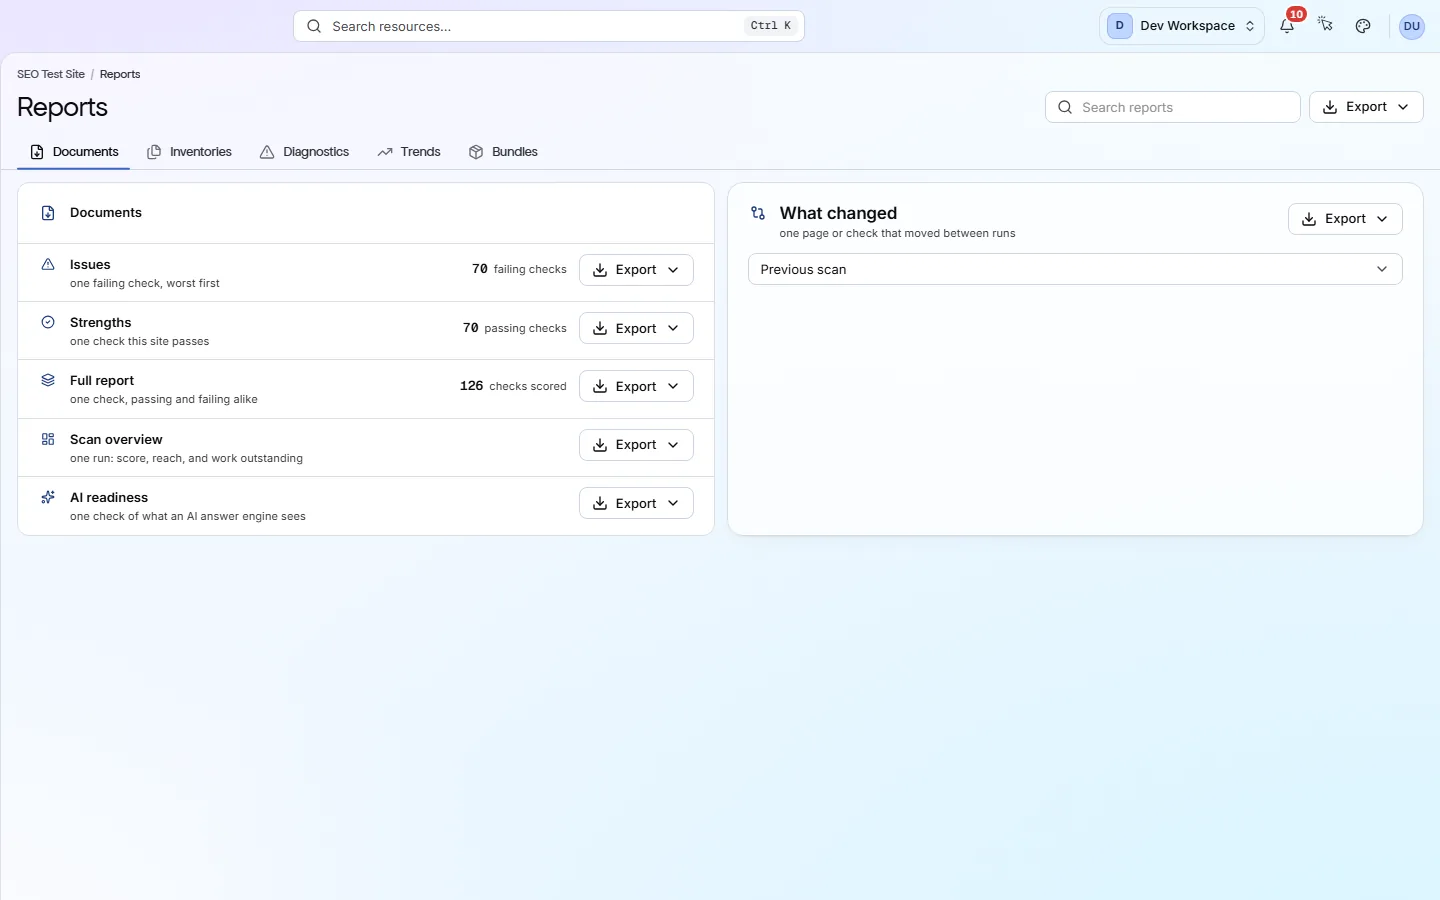
The five tabs#
The 61 reports are sorted by what they are for. Documents is on every tier. The other four tabs are included from Hobby up.
| Field | Contains | What it does |
|---|---|---|
| Documents | Written reports | Six reports written for people: Issues (what to fix, worst first), Strengths (what the site gets right), Full report (both), What changed, Scan overview and AI readiness. Included on every tier. |
| Inventories | Lists | Full lists from the crawl, such as every page, link or image, with their details. From Hobby up. |
| Diagnostics | Problem sets | Lists about one kind of problem, such as broken links or redirect chains (one redirect leading to another). From Hobby up. |
| Trends | Across scans | Scan history tracks your score and counts over time. Config changes records changes to the site's settings. From Hobby up. |
| Bundles | Several at once | Everything puts the datasets into one workbook or JSON file. Sitemap builds an XML sitemap (a list of your pages for search engines) from the crawl. From Hobby up. |
What changed compares this scan with an older one. By default it uses the previous scan of the same branch; pick another in its Older scan to compare against picker. It is the download version of the Changes screen.
Choosing a format#
Open the Export menu on a report's row and pick a format.
Written documents come in all five formats. Data reports come as CSV, Excel workbook or JSON.
On Free, documents list every failing check and what it costs you, but leave out the step-by-step fixes. Upgrade to any paid tier and download again to get them.
| Field | Use it for | What it does |
|---|---|---|
| Sending to a person | A formatted report for clients or managers. It uses your report branding if the workspace has set it up. | |
| CSV | A spreadsheet | A plain table with one row per item. It opens in any spreadsheet app. |
| XLSX | A formatted workbook | An Excel workbook. It also opens in Google Sheets or Numbers. |
| JSON | A script | All the data in a structured format, for your own scripts and tools. |
| Markdown | A ticket or a wiki | Plain text with simple formatting. Paste it into a ticket, a wiki page or a pull request description. |
Add your branding before sending a PDF to a client
Does something here not match what you see in the app? Tell us